There is a moment in the US interconnection record where battery storage stopped being solar's accessory and started outweighing it outright. In Load Factor's current dataset that moment is 2021, and storage has not surrendered the lead in any year since.
This is not a projection or a forecast. It is what developers actually filed.
The crossover year was 2021
Counting queue entries by the year the request was filed, standalone battery storage passed solar in 2021 and stayed ahead:
| Queue year | Standalone storage | Solar | Storage capacity (GW) | Solar capacity (GW) |
|---|---|---|---|---|
| 2020 | 766 | 1,144 | 103.7 | 112.9 |
| 2021 | 1,291 | 1,192 | 234.7 | 115.7 |
| 2022 | 1,218 | 1,239 | 226.6 | 173.6 |
| 2023 | 1,022 | 1,076 | 237.4 | 121.5 |
| 2024 | 897 | 852 | 156.8 | 129.6 |
| 2025 | 928 | 831 | 196.0 | 121.1 |
The capacity column is the one worth sitting with. In 2021 storage filed roughly twice the megawatts solar did — 234.7 GW against 115.7 GW. Four years later the gap has narrowed but not closed: 196.0 GW against 121.1 GW in 2025.
Project counts tell a gentler story than megawatts. By count, storage and solar traded places through 2022 and 2023 before storage pulled clear again. By capacity, storage has led every year since 2021 without interruption. That divergence is itself informative: storage projects are being filed at larger average sizes than solar.
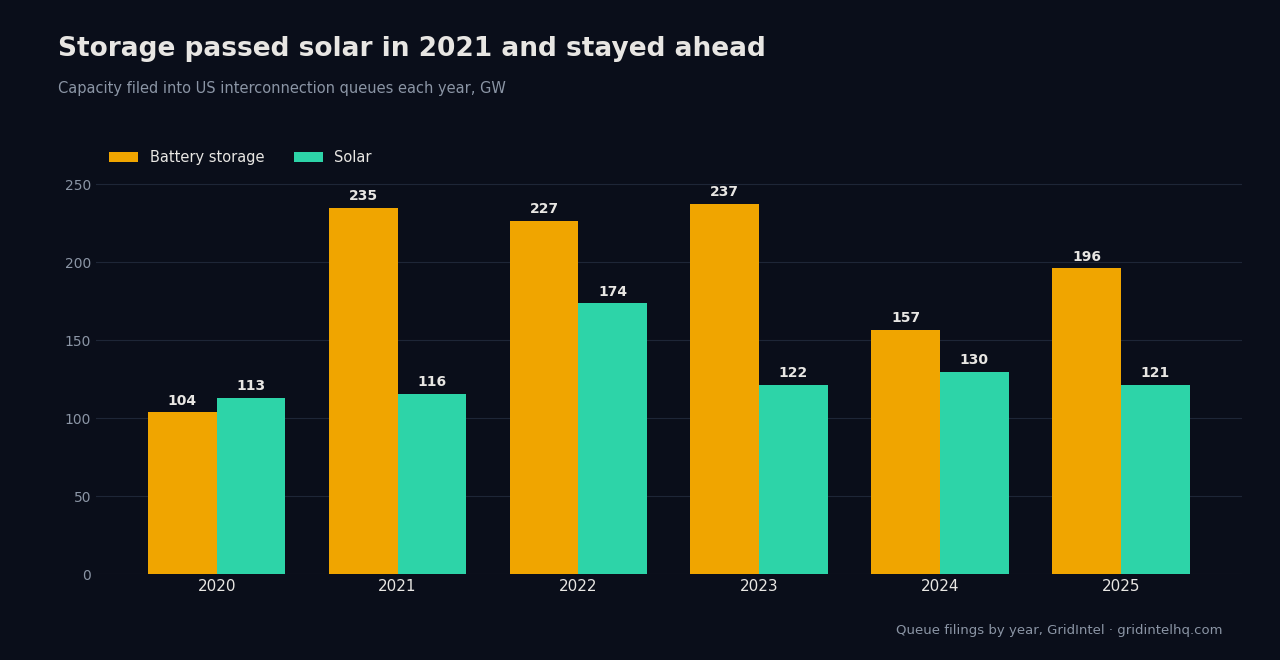
Why the two measures disagree
A queue entry is a request, not a plant. Counting entries measures how many parties are trying; counting megawatts measures how much they are trying to build. When those two series separate, the average project is changing shape.
That is what happened here. Storage did not simply win on volume of applications — it won on scale per application. Anyone sizing a market from project counts alone would have read 2022 and 2023 as a solar recovery. By megawatts, storage never lost the lead.
What this does not tell you
Queue entry is the cheapest commitment in the development lifecycle. A filing is not financing, not an offtake agreement, and not steel in the ground. Withdrawal rates across US queues remain high, and the megawatts above include projects that will never be built.
What the queue does give you is timing. It is the earliest public signal that capital is moving toward a technology, and it moves months to years ahead of the announcements that make headlines. Reading it early is the advantage; mistaking it for a build forecast is the trap.
How to use this
If you are underwriting storage, the filing record says the competition for interconnection position arrived in 2021, not 2023. If you are modelling solar, the flat 120–130 GW band since 2022 is a more honest baseline than any single headline year.
And if you are tracking a specific market, the national picture is the wrong resolution. These totals conceal enormous regional variation — ERCOT, CAISO and the non-ISO West behave nothing like PJM.
Figures are drawn from Load Factor's interconnection dataset covering 41,000+ projects, withdrawn included, across 16 US and Canadian markets, grouped by filing year. Capacity is summer MW as filed.