Any site, or any point.
Start from any of 1,800+ data-center sites, or pick a point and enter the load you plan and the year you need it. Choose a radius of up to 50 miles.
Power near a site · Load Factor Demand
For any data center or any point on the map: the supply queued nearby, the capacity likely online each year, and how it measures against the load you plan.
In the product
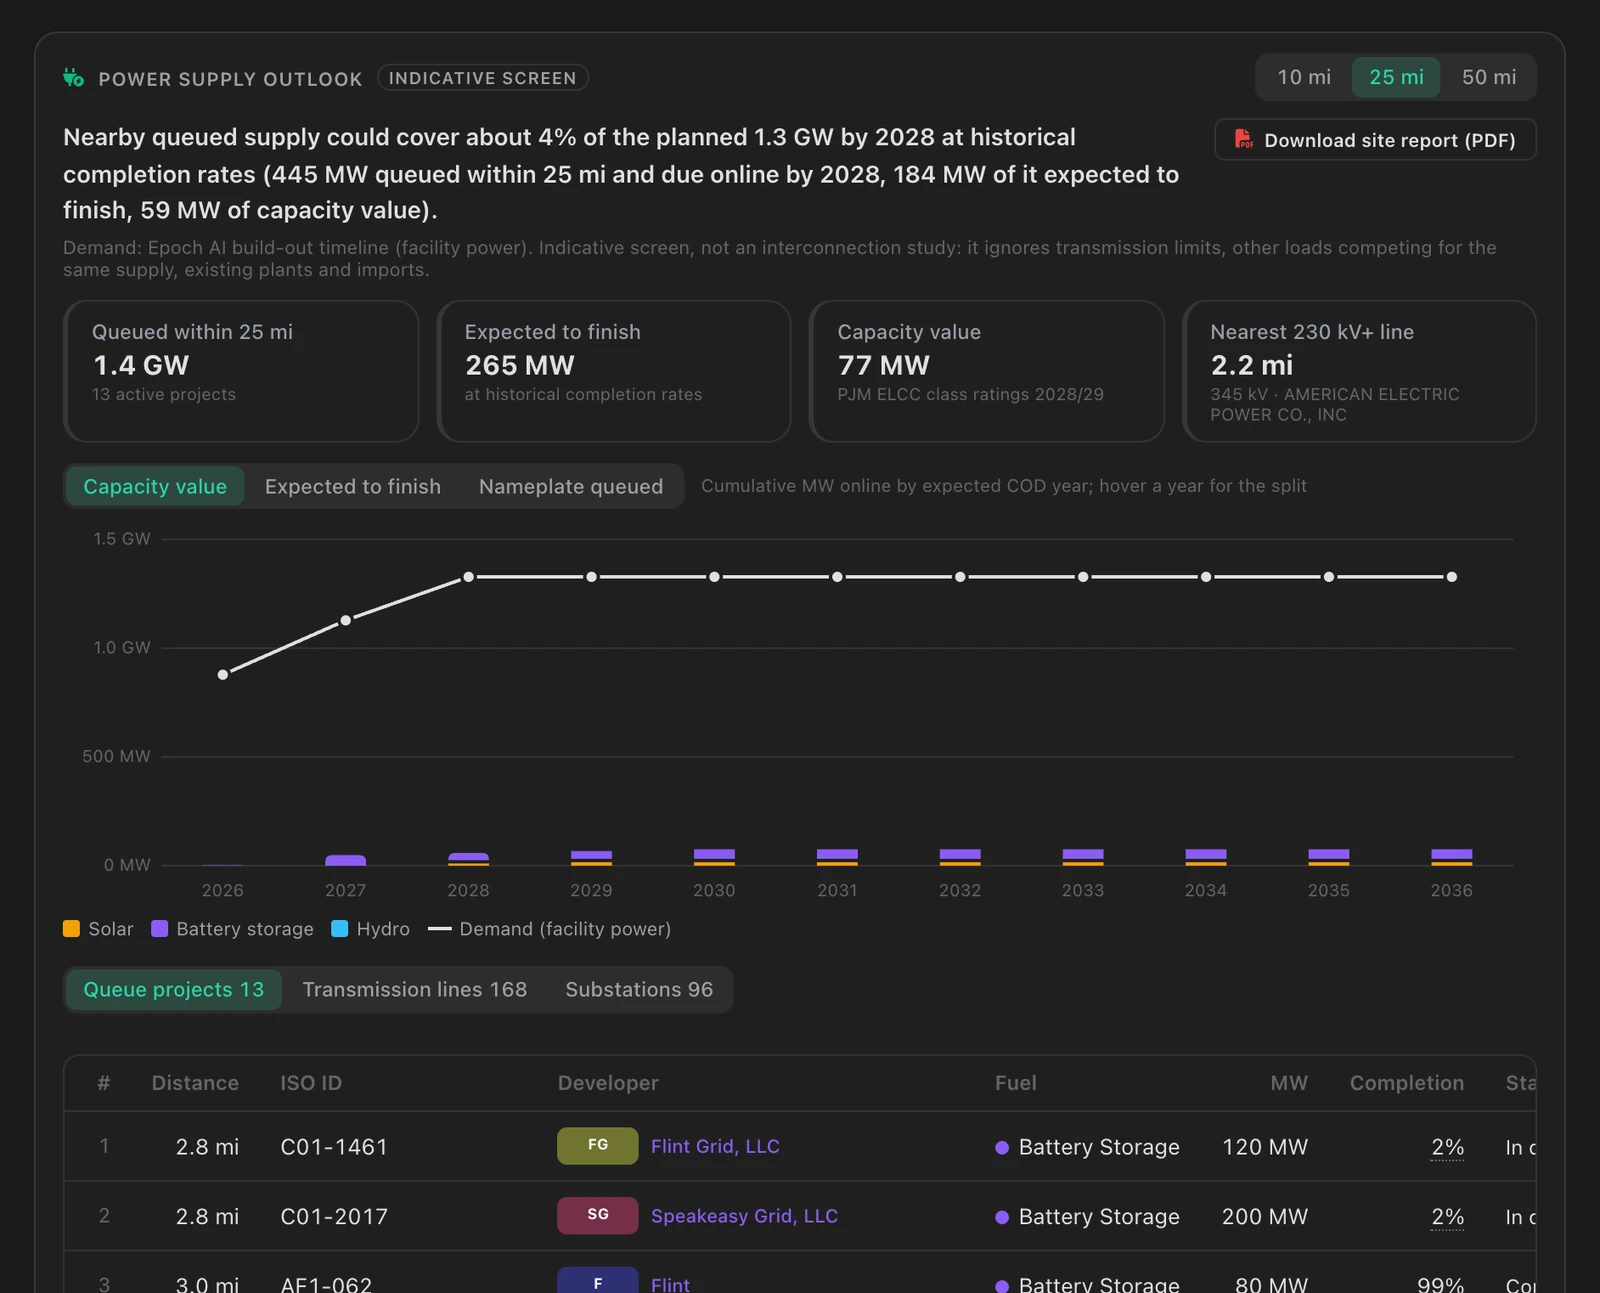
Start from any of 1,800+ data-center sites, or pick a point and enter the load you plan and the year you need it. Choose a radius of up to 50 miles.
The queue projects inside the radius with developer, technology, size, stage and expected online date, the transmission lines with voltage and owner, and the nearest substations.
Queued capacity weighted by historical completion rates and counted at published capacity values, against your planned load. Switch to what is expected to finish, or everything queued.
One line says how much of the planned load nearby supply could cover, and by when. It is an indicative screen, not an interconnection study: it ignores transmission limits, other loads competing for the same supply, existing plants and imports.
The outlook for a site on a one-page PDF, with the sources behind every figure, ready for a team or a client. Included on plans with exports.
The generation queued within the radius you choose, how much of it is likely to come online each year at historical completion rates, and its capacity value, against the load you plan.
No. It is an indicative screen. It ignores transmission limits, other loads competing for the same supply, existing plants and imports.
Yes. Pick any point on the map, enter a planned load and a year, and the same outlook runs there.
Yes. The site power report puts the outlook for a site on a one-page PDF, with the sources behind every figure, on plans that include exports.
Sites come from open map data and state and local public records. Power and build-out figures for AI data centers come from Epoch AI, credited under CC BY 4.0.
More in Load Factor
A walkthrough of the projects, developers and evidence in the markets you work in.
Queue movement, newly identified developers and the week’s deals, every Monday. Read past issues